
TL;DR
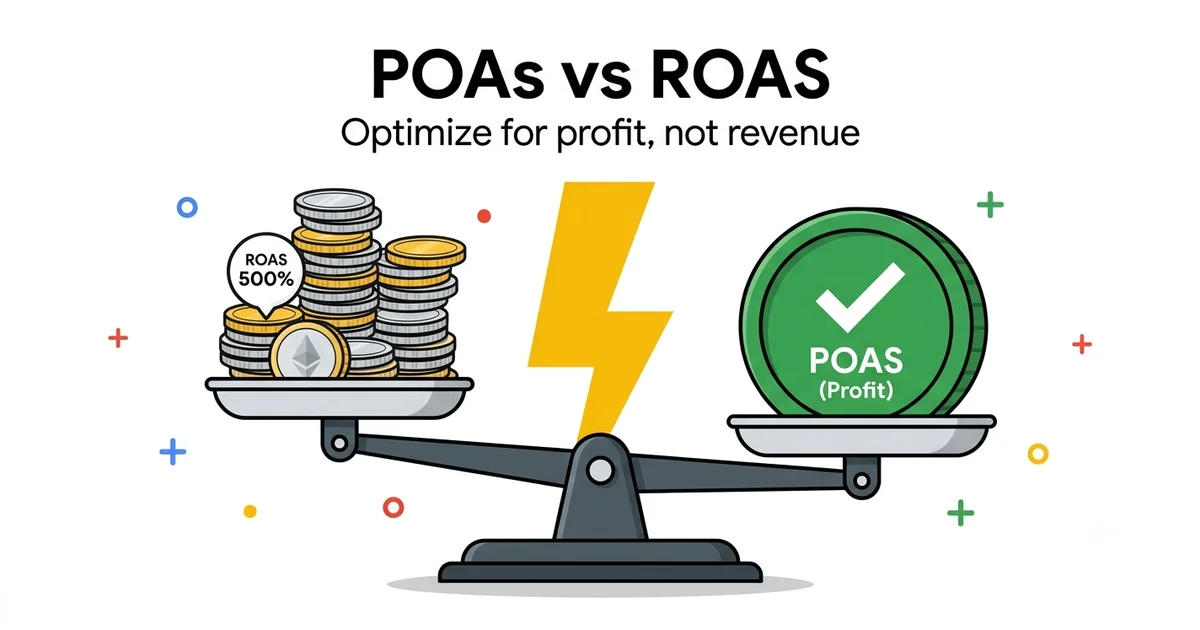
POAS (Profit on Ad Spend) = profit ÷ ad spend. Unlike ROAS, which only measures revenue, POAS measures the actual money left in your pocket. A 4× ROAS can be a loss if margin is thin; a 1.5× POAS is always profitable, regardless of margin. Across the accounts I run, average POAS is 1.78× — that's the metric I look at before ROAS.
1.78×
Average POAS (our accounts)
1×
POAS break-even (always)
1÷m
ROAS break-even (margin-dependent)
0
Accounts with native POAS in the UI
This post builds on What is ROAS and How to Calculate It — read that first if the ROAS formula itself isn't already clear.
Quick answer
What is POAS and how is it different from ROAS?
POAS (Profit on Ad Spend) = Profit ÷ Ad Spend. The formula bakes in margin — while ROAS = Revenue ÷ Spend, POAS = (Revenue × Margin) ÷ Spend. The profitability threshold is always the same: POAS below 1× means a loss, above 1× means profit — regardless of industry or product margin. ROAS has no such universal threshold because it knows nothing about your margin.
Why ROAS lies — same ROAS, different profit
I've seen this play out dozens of times: a client looks at the dashboard, sees a 4× ROAS across all three of their product categories, and concludes they're equally healthy. In reality, one category is generating solid profit, another is barely breathing, and a third — at an identical 4× ROAS — is quietly losing money on every sale. ROAS can't tell these three scenarios apart because it knows nothing about the cost of goods sold.
The problem isn't that ROAS is a "bad" metric — it does exactly what it's built to do, measuring the ratio of revenue to spend. The problem is that people use ROAS as a proxy for profitability, when profitability depends on a third number ROAS never accounts for: cost of goods sold (COGS). Once that number varies by product — and in practice it almost always does, even in seemingly simple catalogs — ROAS stops being a reliable guide for budget decisions.
This shows up most clearly on eCommerce accounts with a broad assortment. A multi-category store selling both high-margin accessories and low-margin "anchor" products (branded electronics at a 5–10% margin, stocked purely to drive traffic) will almost always turn up a finding like the table below — somewhere in the portfolio sits a product with a good ROAS that is quietly eating profit out of the rest of the account. Without a POAS view, that product keeps getting funded because it looks like a "winner" on every standard report.
Here's an illustrative example with three products that share an identical 4× ROAS but wildly different margins — the numbers are deliberately round and simplified for clarity, not pulled from any real client account:
| Product | Revenue | Spend | ROAS | Margin | Profit | POAS | Reality |
|---|---|---|---|---|---|---|---|
| A — Premium line | €10,000 | €2,500 | 4.0× | 50% | €5,000 | 2.0× | Healthy profit |
| B — Standard line | €10,000 | €2,500 | 4.0× | 25% | €2,500 | 1.0× | Break-even |
| C — Budget line | €10,000 | €2,500 | 4.0× | 15% | €1,500 | 0.6× | Loss |
Critical point
All three product lines carry an identical 4× ROAS. If you only look at the ROAS dashboard, they look equally healthy. In reality, Product C loses money on every sale, while Product A generates more than three times the profit on the same spend. Without POAS, budget could be split evenly across all three lines — meaning you're pouring money into the losing line while starving the most profitable one.
This is why a "great ROAS" isn't always good news. Product C would look like the best campaign in the account on paper — same ROAS, maybe even higher sales volume because of its lower price point — when it's actually the only one actively draining profit from the rest of the account.
Break-even math: ROAS and POAS
This is where most people trip up, so let's go step by step. There are two formulas and they get mixed up easily:
Break-even ROAS = 1 ÷ Margin (decimal)
POAS = (Revenue × Margin) ÷ Spend = Profit ÷ Spend
Break-even ROAS depends on margin — the lower the margin, the higher the ROAS you need just to cover spend. Here's a table that shows it directly:
| Margin | Break-even ROAS (1 ÷ margin) | What it means |
|---|---|---|
| 70% | 1.43× | High margin — even a modest ROAS is profitable |
| 50% | 2.0× | Standard for brand-heavy eCommerce |
| 33% | 3.0× | Typical multi-category eCommerce average |
| 25% | 4.0× | Lower margin — 4× ROAS is just break-even, not a win |
| 15% | 6.67× | Low margin (e.g. electronics) — needs an aggressive ROAS target |
| 10% | 10.0× | Razor-thin margin — most accounts here never reach profit through ads alone |
POAS break-even is always 1× — which is why POAS is mentally easier to work with. You don't have to memorize a table for every margin; you just check whether the number is above or below 1. If POAS is 1.5×, for every € spent on ads you got back €1 of spend plus €0.50 of pure profit. If POAS is 0.8×, you're losing 20 cents on every € spent, no matter how "good" the ROAS dashboard looks.
Sanity check (so the math always agrees)
Product B from the table above: 25% margin, break-even ROAS = 1 ÷ 0.25 = 4.0×. Its actual ROAS is exactly 4.0× — meaning it sits right on the break-even line. POAS confirms the same thing: (10,000 × 0.25) ÷ 2,500 = 2,500 ÷ 2,500 = 1.0× — break-even.
Product C: 15% margin, break-even ROAS = 1 ÷ 0.15 = 6.67×. Actual ROAS is only 4.0× — below the threshold, meaning a loss. POAS confirms it directly: 0.6× (below 1×). The two formulas must always agree on the same verdict — if they don't, there's an error in one of the inputs somewhere.
The same logic works in reverse — you can derive the ROAS you'd need for a target profit from a target POAS. Say you want a POAS of 1.5× at a 30% margin: required ROAS = 1.5 ÷ 0.30 = 5.0×. That's a useful trick when talking to a client who still thinks in ROAS terms — translate their POAS target back into a familiar ROAS target, but one anchored to their actual catalog margin, not some industry average from a report.
How to implement POAS in practice
POAS isn't a native metric in the Google Ads interface — Google doesn't know your margin and has no reason to assume one. That means implementation requires you to inject a profit signal where Google would otherwise only see revenue. This isn't a trivial technical detail — each of the approaches below carries a different level of risk, development effort, and precision, so the choice depends on how quickly you need visibility versus how deeply you want the algorithm to actually change its behavior. Here's the order I work through on accounts, from simplest to most sophisticated:
1. Margin data in the feed or conversion value
Two approaches. (a) If you have per-SKU margin in your system, add a custom label to the product feed carrying the margin percentage — this enables grouping products by profitability within campaigns. (b) The more precise approach: instead of conversion tracking sending revenue as conversion value, you send profit (revenue minus COGS minus shipping/returns costs) directly as the conversion value. Google still "thinks" it's optimizing ROAS, but it's actually optimizing POAS, because the value it sees is already profit, not revenue.
2. Custom columns in the Google Ads interface
If you don't want to change conversion value tracking yet (riskier, needs development), build a custom column: Profit = (Conv. value × average margin) − Cost. This gives you a read-only POAS view in standard reports without touching the bidding signal — a good first step before full implementation.
3. Value rules for real-time margin correction
Google Ads Value Rules let you adjust conversion value by location, device, or audience — you can repurpose them creatively to simulate margin differences (e.g. lowering the value of conversions from a segment that typically buys only discounted, low-margin items). A limited fix, but useful when you don't have the developer resources for a full feed/tracking build.
4. Dedicated profit tracking tools
For accounts with complex COGS structures (variable shipping costs, seasonal discounts, payment processing fees), manually calculating margin per order becomes unsustainable. That's where dedicated profit tracking tools come in — they connect to Shopify/WooCommerce, pull real COGS per SKU, and send a clean profit signal back into Google Ads and Meta Ads as conversion value. I personally use ProfitMetrics on accounts where the margin structure is messy — but the principle holds regardless of which tool you use: somewhere, a system needs to know the real profit per order, not just revenue. The advantage of a tool like this over a manually maintained custom column is that it automatically captures margin changes in real time — when a client runs a 20% discount on an entire category, the tool reflects that immediately in the profit signal going to Google Ads, while a manually maintained custom column would stay stale until someone updates it.
The order I recommend: start with the custom column (zero risk, fast), confirm the numbers match your bookkeeping for a month or two, and only then change conversion value so the algorithm actually starts optimizing toward profit. Skipping that verification step and pushing profit straight into conversion value is a common source of errors that are hard to spot later.
A concrete implementation example (illustrative)
Picture an eCommerce account where Google Ads normally receives conversion value = order price (say, €120). For Smart Bidding to see profit instead of revenue, the tracking implementation changes so the conversion value becomes: (order price × average category margin) − fixed shipping cost. For that same €120 order, if the category margin is 35% and shipping costs €4, the value sent to Google becomes (120 × 0.35) − 4 = €38, not €120.
The algorithm still "thinks" it's optimizing conversion value/ROAS — but since the value itself is now profit, it's effectively running Target POAS. This is why the implementation needs careful coordination with a developer and bookkeeping: a wrong margin formula (e.g. gross markup instead of net margin) feeds the algorithm the wrong signal, and it optimizes toward the wrong target with no warning anywhere in the interface.
When POAS isn't needed
POAS isn't a universal fix and shouldn't be forced everywhere. If you have uniform margins — every product in the account carries roughly the same margin (say, 30% ± 3%) — then a ROAS target already implicitly encodes profitability. In that case, the extra POAS infrastructure is overhead without real benefit: development time, tracking risk, and the ongoing maintenance of margin data cost more than they return, since the resulting bidding decisions would be practically identical to what you'd get from a well-calibrated ROAS target based on that same average margin.
POAS makes sense when
- Margin varies 15+ percentage points across product categories
- You run premium and budget lines in the same account
- The portfolio spans multiple categories (e.g. apparel + electronics)
- Rev-share or profit-share contracts with the client (profit = your fee)
- Seasonal discounts swing margin dramatically month to month
A ROAS target is enough when
- Uniform margin across the whole catalog (mono-brand, single category)
- Small SKU count with a similar pricing structure
- Lead gen accounts (no real COGS concept — see FAQ)
- No developer/tracking resources to implement it within a reasonable timeframe
- The account is too small to justify extra tracking infrastructure
A practical rule I use: if the margin gap between the most and least profitable product category is under 10 percentage points, POAS rarely changes budget decisions compared to a well-calibrated ROAS target. Above that, POAS starts to genuinely change recommendations — and it's worth investing in the implementation.
There's also a middle option I often recommend to small and mid-size accounts unsure whether they need the full build: run a one-off custom column analysis (done manually, outside Google Ads, in a spreadsheet) at the product-category level. If that one-time analysis shows margin differences shift the profitability ranking of products relative to their ROAS ranking, that's the signal it's worth investing in a lasting POAS setup. If the rankings match, ROAS is a good enough proxy and you can save the development budget for something else.
What changes in bid strategy when the algorithm sees profit
This is the part that surprises clients the most: when the tROAS algorithm optimizes toward a conversion value that's actually profit (not revenue), bidding behavior changes fundamentally — not just the numbers in the report. This isn't a cosmetic change to the metric you look at on a dashboard; the actual function the algorithm tries to maximize changes at the level of every single auction, thousands of times a day.
In practice, that means two auctions that would previously have looked identically valuable under a Maximize Conversion Value goal (say, both worth €100 in conversion value) can now get entirely different bids — if one comes from a product with a 50% margin and the other from a product with a 10% margin, the algorithm will bid more aggressively for the first. That's a fundamental difference from a standard tROAS setup, where both auctions would be treated exactly the same since their conversion value (revenue) is identical.
- The algorithm starts favoring high-margin products, even if they generate lower revenue per transaction. A product bringing in €50 revenue at 60% margin (€30 profit) becomes "worth more" to the algorithm than one bringing in €80 revenue at 15% margin (€12 profit) — even though the second product would look better under a pure ROAS/Maximize Conversion Value goal.
- Budget naturally reallocates toward ad groups and campaigns tied to more profitable product lines, with no manual intervention — the algorithm does this automatically because it's optimizing the signal you gave it.
- The target needs recalibrating — if you previously had a tROAS target of 400% based on revenue, once you switch to profit-based conversion value, that same numeric target no longer means the same thing. It should be set based on the POAS break-even (1×) plus a margin of safety — e.g. a target POAS of 1.3–1.5× for a healthy buffer above break-even.
- Volatility rises in the short term — profit per order has more variance than revenue (margin fluctuates with discounts, promos, and product mix), so the algorithm needs a somewhat longer learning period to stabilize its predictions.
- Client reporting gets more direct — instead of "ROAS is 4×, great," the conversation becomes "POAS is 1.6×, meaning every € invested returned 60 cents of clean profit after all costs." That's a conversation clients with a finance background grasp and appreciate immediately.
What this means in practice: when you switch to profit-based bidding, the first report after the change often looks "worse" by the old standard — total revenue can dip slightly because the algorithm deliberately pulls back spend from low-margin products it used to push aggressively. That's not a regression, it's exactly what you asked for — less revenue from poorly profitable sales, more budget where every € of ad spend generates real profit. Across the accounts I run, this transition typically means a mild dip in total revenue in the first month, followed by growth in total profit over the next 2–3 months as budget fully redistributes. That's why an average POAS of 1.78× is a more valuable data point than any single ROAS number — it tells you what the client actually earns, not how much turnover the account generates.
FAQ
What POAS is good?▼
How do I start with POAS without developer resources?▼
Does Google Ads support POAS natively?▼
Does POAS make sense for lead gen accounts?▼
How long does the transition from ROAS to POAS take?▼
Not sure how much of your ROAS is actually profit?
Free account analysis with POAS mapping by product category and margin-based bidding recommendations.
Book a free consultationRelated guides
What is ROAS and how to calculate it
The base formula, benchmarks, and calculator
Smart Bidding guide
tROAS, Maximize Conversion Value, and when to use each
Conversion Tracking guide
Without accurate conversion value tracking, POAS is fiction
Google Ads for eCommerce
Service: Back to Basics account management
Google Shopping Guide
Feed optimisation, priority-based structure, and Target ROAS bidding
Free video audit
Get a Personalised Video Audit of Your Google Ads Account
I'll record a 15-minute walkthrough of your campaigns showing exactly where you're losing money and what to fix first.
Free personalised video audit
Want a video walkthrough of your Google Ads account?
I'll personally record a 15-minute video walking through your campaigns, showing you where you're losing money and giving you 3 specific things to fix immediately. No sales pitch — just value.
What you get:
- 15-min personalised video analysis
- 3 specific quick wins to implement
- Budget & bidding recommendations
Requirements:
- Ad spend: $1,500+/month
- Active account for 3+ months
- eCommerce or Lead Gen business
Limited to 5 audits per month. Response within 48 hours.